

SeaDataNet-MyOcean joint meeting report
- Overview
- SeaDataNet Products
- JCOMM: Real time and and archived data synergies: toward the WIGOS for the Ocean Observing Components
- Presentation of aggregation activities
- Specifications on SDN2–MyO2 exchange
- MyOcean In situ TAC: Plan for assembling and reprocessing ‘historical’ data
- Summary and Conclusions
I. Overview
S. Pouliquen presented the context of the historical product elaboration for European research and operational community. She reminded that MyOcean In situ TAC (Thematic assembly Center) and SeaDataNet Infrastructure are the pillars of data exchange for physical environment observations in Europe, mainly for the observing systems operated by EuroGOOS and ROOS (Regional Operational Observing System) members. Both projects are working on aggregated Temperature and Salinity products for the past 25 years, MyOcean for reanalysis purposes, SeaDataNet for demonstrating the value of the SeaDataNet Infrastructure. In order to better serve both MyOcean and SeaDataNet users it will be fruitful to join our efforts to build such products in jointly. This will also demonstrate the complementarity of these two infrastructures and contribute to show the importance of sustaining them.
II. SeaDataNet Products
G. Maudire presented SeaDataNet2 WP10 activity overview, as described in the Document of Work (DoW). He first described the SDN2 products:
- Collections of Observations data: aggregated data set should include all available data within SeaDataNet database that are both open access data or fall Under SeaDataNetLicense.
Aggregation procedure should act per Sea Region, per parameter, per instrument, per year and could be delivered as netcdf file or zipped ODV ASCII files. - Interpolated Fields: computed from the collection of observation (restricted data could be added) and should include one field per region per parameter at fixed horizontal resolution and for fixed depths. The annual analysis is mandatory but could be seasonal or monthly according to the data availability and should be provided as netcdf file.
Data product must be described and made accessible in a product catalogue (ISO 19139 standard to be Inspire compliant) via OceanBrowser:
- Map with observation location at the surface for each Regional Collection of Observations
- Maps of interpolated field available in the OceanBrowser.
First priority of WP10 activity is the Collection of Observations, while Interpolated Fields production should assess their overall quality. G.Maudire mentioned some technical implementation that should facilitate data aggregation process (improved user interface, new query processor, ODV new release with improved aggregation facilities). He underlined at the end the importance of the collaboration with MyOcean for SDN products validation and wished harmonization of SDN2 and MyO2 time schedule and data deliver.
There was an agreement that both MyOcean and SDN licence should be modified to recognize that such aggregated regional product were made jointly and therefore equality recognized as contributor. There was also an agreement on the importance of having a COMMON ACCESS procedure to the Joint SDN2-MyO2 Collection of Observation before the end of MyO2. T. Loubrieu mentioned that it was already in the plans of MyOcean Central System development.
III. JCOMM: Real time and and archived data synergies: toward the WIGOS for the Ocean Observing Components
N. Pinardi presented an overview of the European marine data streams for Real Time (RT) and Delayed Mode (DM) data and their relationship. She introduced The WMO Integrated Global Observing System (WIGOS) and described the connection of RT with DM data centers and highlighted the limits of this systems which is still too “physics oriented” and focused on the open ocean. She then described the WMO-IOC Joint technical Commission for Oceanography and Marine Meteorology (JCOMM) and the opportunities that JCOMM offers. She concluded with some suggestions on the way forward.
IV. Presentation of aggregation activities
MyOcean In Situ TAC
MyOcean is the implementation project of the GMES Marine Core Service, aiming at deploying the first concerted and integrated pan-European capacity for Ocean Monitoring and Forecasting. Within this project, the in-situ Thematic Assembly Centre (in-situ TAC) of MyOcean is a distributed service integrating data from different sources for operational oceanography needs. The MyOcean in-situ TAC is collecting and carrying out quality control in a homogeneous manner on data from outside MyOcean data providers to fit the needs of internal and external users. It provides access to integrated datasets of core parameters for initialization, forcing, assimilation and validation of ocean numerical models which are used for forecasting, analyses (nowcast) and re-analysis (hindcast) of ocean conditions. Since the primary objective of MyOcean is to forecast ocean state, the initial focus is on observations from automatic observatories at sea (e.g. floats, buoys, gliders, ferrybox, drifters, SOOP) which are transmitted in real-time to the shore. The second objective is to set up a system for re-analysis purposes that requires products integrated over the past 25 years.
An important task in MyOcean2 is to develop for the 6 regional seas covered by the MyOcean In Situ TAC (Arctic, Baltic, North West Shelves, South West Shelves, Mediterranean Sea, Black Sea) an aggregated T&S product for the period 1990-2012. This product will aggregate data coming from SeaDataNet, to data from monitoring centres not connected to SeaDataNet and international networks as described in the figure below:
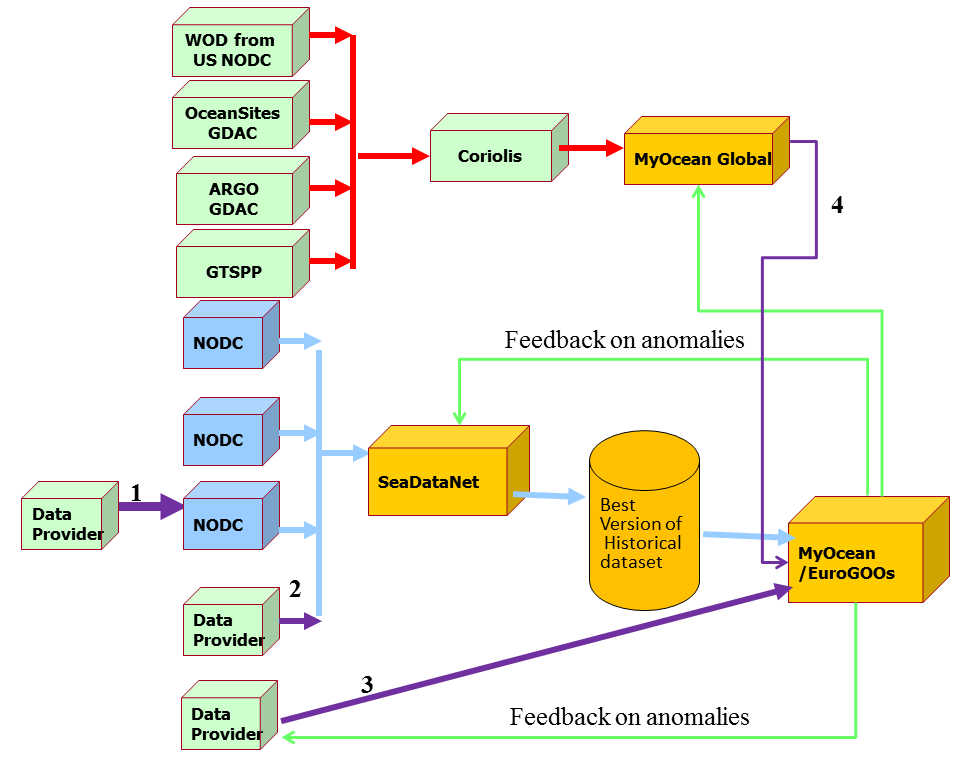
Fig. 1 Interfaces to Data providers for building MyOcean Regional aggregated products
S. Pouliquen presented the priorities for MyOcean in term of data:
- Focus on Temperature and Salinity free access to registered users observation. If MyOcean users need restricted access data they will get them directly from SeaDataNet
- Focus on regional European seas and in particular in unlocking data in areas where data gaps have been identified
- First priority is profile (CTD , XBT) or time series at depth (Fixed point stations), second priority surface data (Ferrybox)
She highlighted the fact that feedback will be made to SDN on the anomalies detected and that it should help SDN regional coordinators in their validation activities.
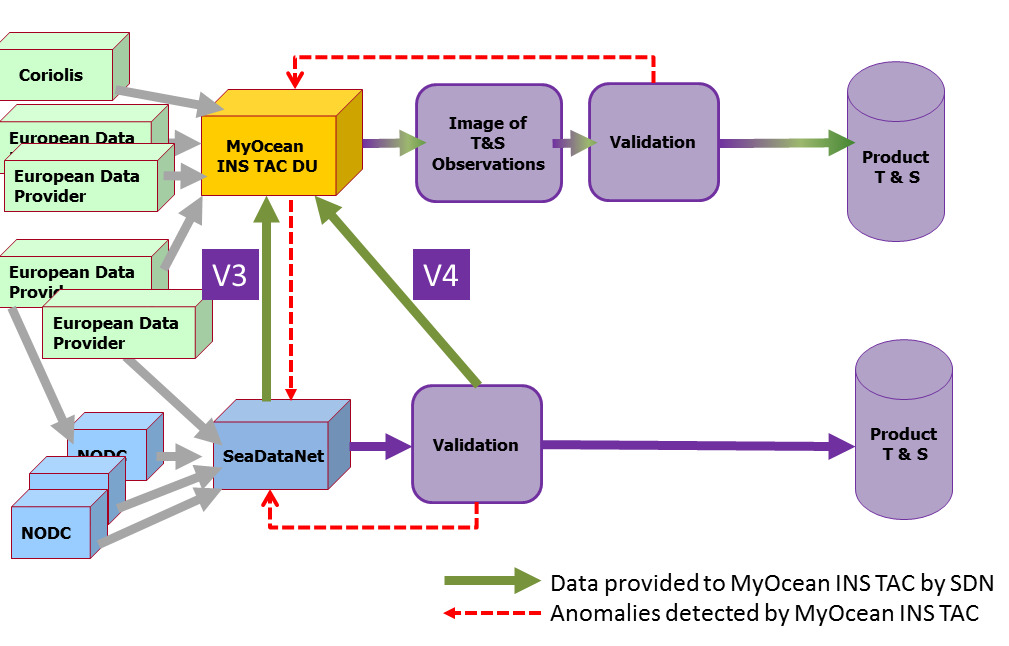
fig. 2 Proposed interfaces between SDN and MyO
Finally she mentioned that we should set up a data flow to allow easy updates between SeaDataNet and MyOcean on a yearly or every 2 years basis and could be extended to other parameters such as Chl, nutrient, oxygen. We should also aim at building historical aggregated product as a joint European aggregated product that can be distributed both by MyOcean and SeaDataNet.
SeaDataNet WP10
S. Simoncelli introduced the WP10 objectives within SeaDataNet2 Projects and the role of the partners in the activities that must be conducted at regional level and coordinated by the Regional Coordinators (RC).
Med Sea | INGV | Simona Simoncelli | |
Black Sea | METU | Devrim Tezcan | |
North Atlantic | IFREMER | Christine Coatanoan | |
North Sea | MUMM | Serge Scory | |
Arctic Waters | IMR | Helge Sagen | |
Baltic Sea | SMHI | Örjan Bäck |
She presented the list of deliverables and the time schedule of WP10 activities, with particular focus on the first deliverable D10.1 due for the 30th of September 2012 which might contain common specification about the aggregation procedure to create the Collection of Observations and to compute the Gridded Fields for the relevant parameters, matter of discussion of the Joint Meeting. She proposed also a feasible common time schedule that would meet both project requirements.
She proposed a Quality Check (QC) strategy (see fig. 3) for SDN2 data that include a first step QC at NODC level, a second step QC done at regional level from the analysis centers (WP10 activity) and a feedback loop (duplicates identification, wrong flags, data gaps) to the NODCs that should verify and correct the CDI information. This process should iterate to assure a continuous improvement of SeaDataNet database quality.

fig. 3 Schematic of the QC strategy within SeaDataNet Project
She brought an example about Data Policy within SeaDataNet and the possible consequences in the interaction with MyOcean but also for the overall quality of the Collection of Observations. The Collection of Observations should include only open access data or data under SeaDataNet License but at present there are still conspicuous percentages of restricted data in different basins, in particular in the Mediterranean Sea (the worst case) there are still 38% of data restricted. Restricted data could be included for internal use only to produce the Gridded Fields.
In conclusion she remarked the open questions for further discussion:
- define and formalize the QC feedback procedure between RCs and NODCs and the action that the NODCs should enforce;
- define a metadata that describe the aggregated (checks and statistics performed to produce it);
- how to reference the Collection of Observations and acknowledge both the data provider and the analysis centers that validated its quality;
- how to perform the upgrade of the Collection of Observations in order to re-iterate and consolidate this procedure in the future.
Regional Product Elaboration: Quality Check based on SDN1 experience
M. Tonani presented an overview of the QC procedure adopted during SeaDataNet1 Project and its importance in the gridded field (climatology) quality. She presented an example of QC done with ODV software applied to the Mediterranean pool of data: the pool of data has been first visualized, then the domain has been refined using polygon definition, thus avoiding unnecessary observations. Then the quality flags have been selected and a range check discarded unrealistic values. Duplicate detection consisted in defining small time, longitude and latitude intervals and checking for observations falling within them. Spike detection represents the last phase of QC but a visual inspection is required before data export as ODV spreadsheet format compliant with DIVA software.
S. Simoncelli briefly talked about some extrapolation techniques applied in SDN1 to extrapolate data on the bottom avoiding unrealistic values. This can be necessary when there are data gaps and in particular topographic structures like isolated deep basins. This procedure has been set up in the context of numerical model initialization and tuned in particular for January conditions.
M. Tonani presented another issue that should be taken into account for climatology production that is the water masses modification due to climatic transitions. She presented the case of the Eastern Mediterranean Transient and the need to define two climatologies, pre and post transient, to better represent the climatological basin state as confirmed by comparison with observations. This is important for both model initialization issues but also when the climatology is used for QC procedures. She concluded pointing out that a good climatology is computed taking into account the basin characteristics, its spatial and temporal variability, the data density and distribution and the user needs.
CDI Content and Statistics per Sea Region within SeaDataNet
S. Simoncelli presented the work done in the first year SDN2. In accordance with what previously stated with MyOcean in situ TAC needs and WP10 objectives, the RCs diagnosed the CDI content and elaborated statistics on data distribution using the following criteria:
- Time period 1990-2012
- Temperature and Salinity profile observations
- all instrument types
- data policy statistics
Data distribution per year (histograms), per parameter, per instrument and per data policy (unrestricted, under SDN License or restricted) have been presented per each regional basin, together with maps showing the overall horizontal data distribution.
Data distribution per year highlighted the decrease of the number of observations in the CDI from 2010 later on, indicating a time lag of about 3 years, which is comprehensible in a historical data base content but it could be reduced. Other data gaps (like 1992 in the Med Sea, late nineties in the Black Sea) should be further investigated to understand if these are realistic or an artifact due of missing entries in CDI. Data policy statistics pointed out the presence of a lot of restricted data in the Mediterranean Sea (38%), Black Sea (17%), Atlantic (12%), that for temperature and salinity, is too high nowadays, since the EU is pushing ahead to open access to this kind of observations.
Maps of data distribution show horizontal data gaps, especially along the coasts of the Mediterranean Sea (Tunisia) and Baltic Sea, while very few data are present in the Arctic Sea and further investigation are needed to check for new observations to be inserted in the CDI.
This preliminary work revealed the limit of the bounding box selection in the web interface and we recommended to improve it, suggesting a simple polygon search.
C. Coatanoan presented some statistics about North Atlantic data and the IBI (Iberian-Biscay-Ireland) zone where she did a detailed comparison between the data availability in SDN infrastructure and MyOcean showing yearly distribution maps. The result of this comparison is the lack of data inside the CDI thus she tried to identify the data owner to stimulate their injection in SDN infrastructure. She then presented an example of Joint SDN2-MyO2 product (see fig. 4). She finally described some validation procedures performed at CORIOLIS for IBI products.
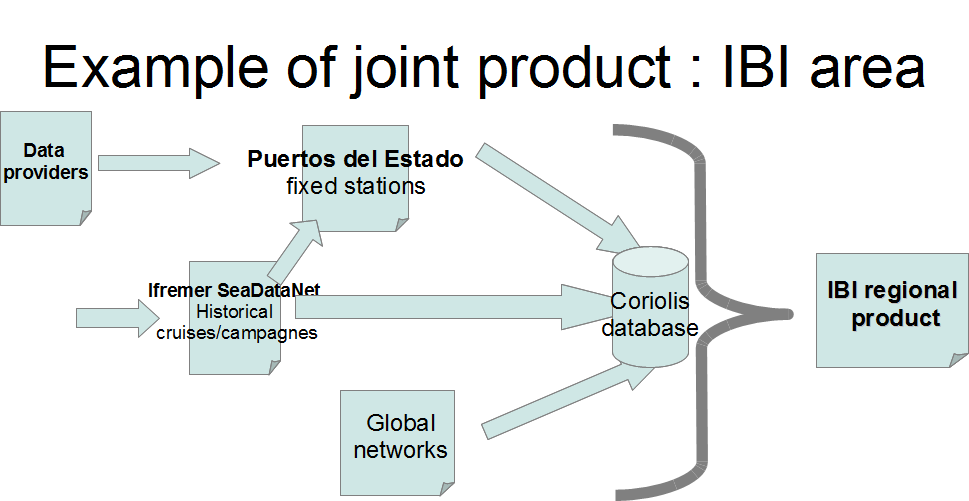
fig. 4 Schematic of procedure to generate a joint product
V. Specifications on SDN2–MyO2 exchange
A. Grouazel presented the necessary specifications on data from SDN to MyO. Observations must have:
- date
- location
- level of immersion (pressure or depth)
- quality flags (common definition between SDN and MyO)
A set of observations must belong to a unique platform. Each profile and each time-series must be identified with a unique SDN ID that would be used to identify a station and also it’s modification between two data exchange between SDN and MyO. CDI number is a candidate for SDN ID as long as modification is properly tracked as well as deletion. Further discussion with D. Schaap, showed that more training to NODCs on data holding updates will be necessary to guaranty this unique ID.
One observation available in different NODCs should be provided once (the best quality), avoiding duplicates. This should be resolved in SDN since the NODCS are requested to delete possible duplicates.
He then addressed the format of the Collection of Observations, suggesting ODV format or NetCDF. NetCDF files with common characteristics would be preferable to avoid error of conversion from ODV format. Moreover in the data sets a unique variable name should be used for Temperature (TEMP) and Salinity (PSAL), PRESS for pressure and DEPTH for immersion even if NODCs use different variable names. This will be done through ODV software that will aggregate the different variable names in the suggested one. The data can be provided manually to MyO via FTP.
In order to benefit from validation activities performed by MyO regional centers validation, he proposed to generate Alert that will explain what are the anomalies detected and what are the action taken on the quality flags. The proposed template for MyO alerts is shown in fig.5.
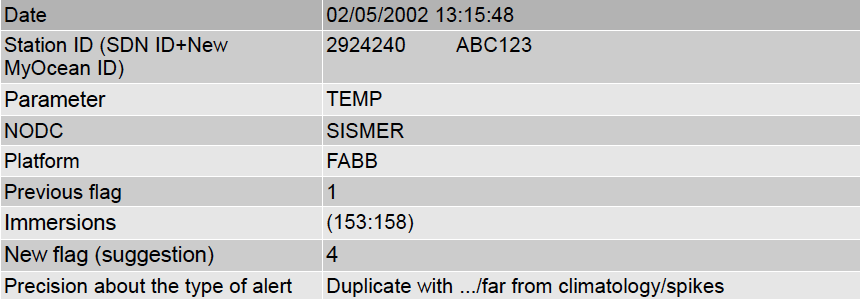
fig. 5 Template of proposed alert description
A report on all the anomalies corrected will be provided by email once to SDN RC.
RCs must reply to MyO alerts communicating to MyO and to SDN NODCs the decision that has been taken and the proposed action at the CDI level. After a brief discussion the participants agree on the fact that NODCs should take action modifying the CDI and keeping track of the modifications to make the update process of the Collection of Observations more efficient.
He concluded with the specifications of an update loop between SDN and MyO for the regional products update. The SDN update dataset should include only the new data to avoid duplicate generation, together with the data that have been modified from the previous release. SeaDataNet should inform on the data that have been deleted from CDI and when the SDN update has been generated.
The decisions about the common specifications have been taken with the objective to re-iterate the update process, to improve the overall quality of the joint SDN-MyO product and to share the workload on product and procedure validation.
VI. MyOcean In situ TAC: Plan for assembling and reprocessing ‘historical’ data
Atlantic
The strategy for the SOUTH West Atlantic was presented by C. Coatonoan and performed jointly with SDN where complementarity between the two system have already been identified (see SDN summary in previous section).
Mediterrenean Sea
L. Perivoliotis (HCMR) presented the “Data assembly plan”, while G.Notarstefano (OGS) presented the “Reprocessing of in-situ T&S data » in the Mediterranean Sea. In the framework of the MyOcean2 project, OGS is in charge of the reprocessing of the physical variables (temperature and salinity) in the Mediterranean Sea collected with in-situ platforms belonging to several European research institutes between 1990 and 2010. The method developed at OGS includes “cross validation” check, the comparison to a climatology (MEDAR-MEDATLAS) and a statistical check. Measurement differences are analyzed as a function of their spatial and temporal distances; a consistency check of measurement inside a defined spatial and temporal window (2x2deg, 60days) is performed.
SDN-MyO joint effort and collaboration in data quality control procedures should exploit the SDN gridded field production and deliver at month 36 of the project to create targeted climatologies to be used and improve the QC process in future dataset upgrade. A first step of interaction could be done taking into account the SDN1 climatologies, like the Mediterranean one which include and further extend MEDAR-MEDATLAS climatology up to year 2009.
BOOS Integration of Historical Products
T. Hammarklint presented the MyO creation procedure of historical data products for the Baltic Sea and the integration of Delay Mode (DM) data with Real Time (RT) and Near Real Time data (NRT). The NRT holding will be updated by adding historical CDT monitoring cruise data from SMHI (October 2012), extend data coverage for the stations that are already providing real time data ( December 1992). He identified the Institutes that will provide the historical data by December 2012. He also identified that he was planning to rely on SDN for Danish and Russian data as well as for sea level historical data.
For validation of historical data done on a yearly basis will consist of screening procedures, comparison to available climatology.
Black Sea
V. Marinova (IOBAS) mentioned that she was planning to build the historical product by integrating data from Bulgarian and Romanian Database as well as the Black Sea Oceanographic Database (BSOD) and Coriolis database for global network ( Argo Drifter).
Validation will be done using ODV. Both metadata and data will be checked (spikes check, climatic check (Medar/Medatalas, SeaDataNet climatologies; T&S time series are validated by using long term time series extracted from BGDB density inversion check).
Summary and Conclusions
The objectives of SDN2-MyO2 Joint Meeting were:
- to define MyO2-SDN2 interaction to elaborate jointly Regional T&S product for 25 years reanalysis planned in MyOcean2
- define the SDN2 Collection of Observations products
- define the interfaces between the two projects, the data flow, the information exchange
- set up a common QC strategy
The first step has been the definition of a common time schedule and QC strategies, shown in fig.6. Some efforts are required from SDN2 partners to be able to fit MyO time schedule and deliver to the in situ TAC a first “raw” Collection of Observations (V1 AGGREGATE) in December 2012, latest in January 2013, which means 9 months in advance than the due date. This implies the release of “raw” regional aggregated dataset that include all Temperature and Salinity observations (profiles and time series) with free access (unrestricted and under SDN License) from all the instruments for the time period 1990-2010. The first release will include all the QC flags coming from the NODCs but would be not validated from SDN analysis centers (RCs). Further specifications about the Collections of Observations are under preparation and due as SDN D10.1 report on September the 30th.
MyO in situ TAC will perform a scientific assessment on SDN T&S product and deliver in April 2013 a joint MyO-SDN product, which will contain also data from other sources. The result of MyO validation will be shared with SDN RCs and a list of alerts (see fig.5) will be sent the RCs. The RCs will perform independently their quality control analysis on V1 AGGREGATE, will reply to MYO alerts and report to both MyO and NODCs (through ODV log files) about the QC analysis. The first feedback on the quality of V1 AGGREGATE will be shared in March/April 2013 in a Joint Meeting. In the meantime it is crucial that the NODCs take action at the CDI level according to the RCs report on QC containing both MyO alerts and RCs log files. This action should be enforced for December 2013(?) in order to assure an efficient dataset upgrade.
In April 2014 MyO will receive a first feedback from its users about the quality of the Joint MyO-SDN product. At this time another Joint Meeting might start to discuss about the V1 AGGREGATE outcome and prepare the update of the Collection of Observation (V2 AGGREGATE) due for September 2015. Moreover SDN RCs might present the Gridded Fields that are due for September 2014 and their possible implementation in the QC common analysis. SDN2 gridded fields are going to be specified too in the D10.1 report. Their definition will take into account their possible usage in future QC procedure that would assure a higher quality to the future versions of Collection of Observations and the derived statistical products. We both believe that this approach would set up an iterative procedure that might last much longer than the Projects duration.
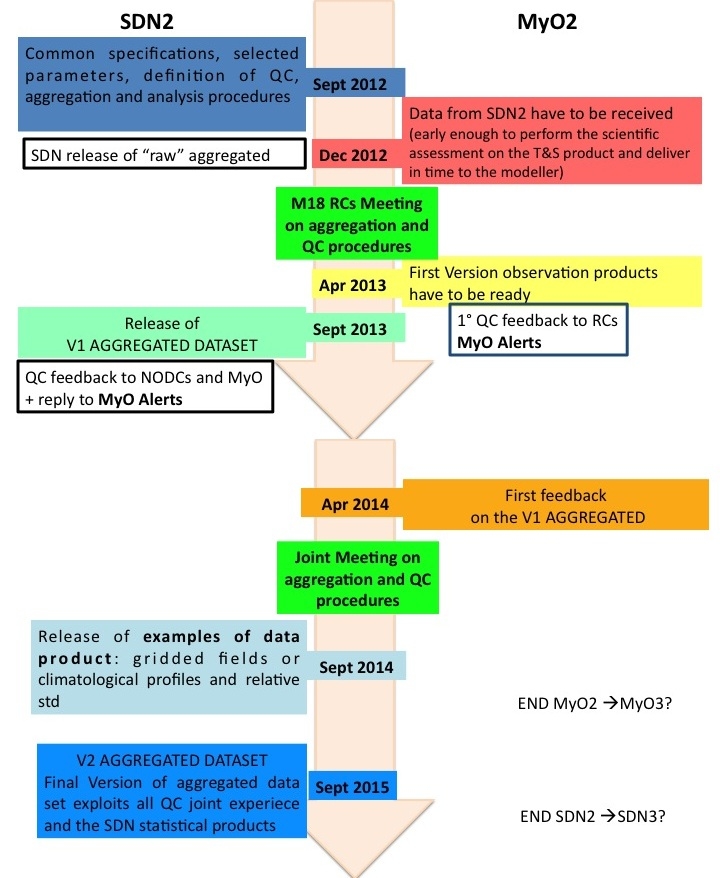
fig. 6 Joint SDN2-MyO2 time schedule
Technical improvements (automatic data query) scheduled in SDN2 project for the end of November 2012 will facilitate the RCs in downloading the regional Collection of Observations. A new version of ODV software, with enhanced aggregation capabilities will be tested internally to the SDN2 Project, before official release. RCs wish for a more efficient domain selection (polygon definition) implementation in the web user interface to make the data search activity more efficient.
A. Grouazel successfully synthesized the specifications on SDN2–MyO2 exchange of information and data flow. The subsequent discussion regarded the unique identification of data within the CDI and its implication for the upgrade process.
Other important point of discussion was the acknowledgment of the Joint MyO-SDN products and their distribution. In fact, according to the proposed time schedule, MyO will release the Joint product to their partners and users in April 2013 while official V1 AGGREGATE release will be in September of the same year. MyO will include in the outcome historical products the acknowledgment to SDN Project and propose sent to SDN all the access statistics to SDN to be included in the SDN monitoring report. SDN proposition is to have a joint access to the portal or to put the Joint product in both portals. MyO replies that the first product release will not be yet a Joint MyO-SDN product since MyO will complement it with other external data sources due to the non-completeness of SDN infrastructure yet.


